Testing Large Language Models: An Overview
This post lays out a quality-assurance strategy for LLM applications. It first introduces the core components of an LLM application, then distinguishes the different focuses of model evaluation and system evaluation, and works through system-level evaluation metrics covering knowledge, safety, and applicability. On the business-testing side, it stresses the importance of setting explicit goals and designing metrics to match, illustrated with concrete scenarios. It then analyzes the risks of prompt attacks and how to respond, and introduces common performance metrics. It closes with the three key stages of LLM quality assurance: securing the model, running engineering tests, and continuously evaluating effectiveness.
The System Under Test
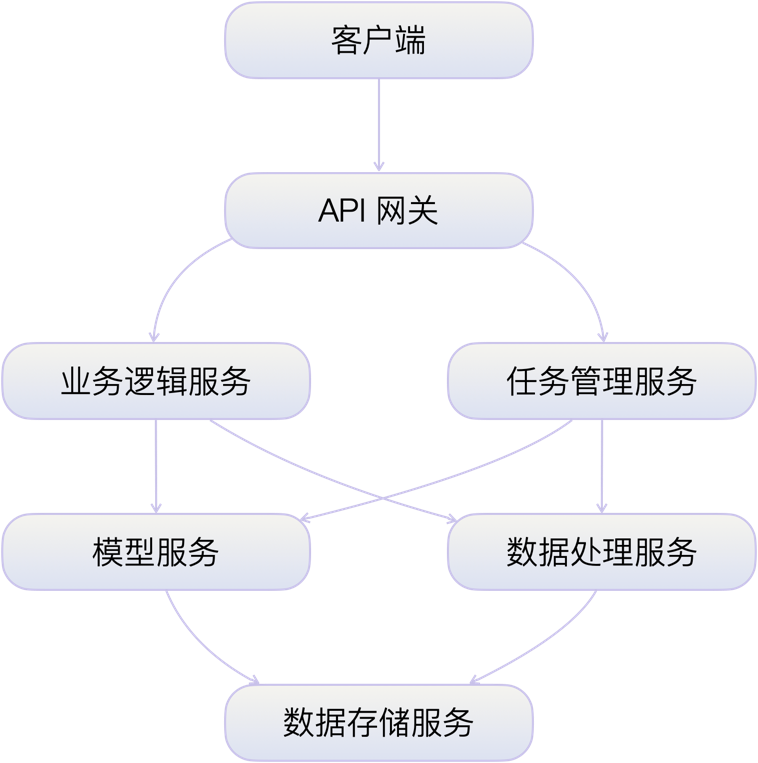
An LLM application is typically built from several core layers and components that together form a complete system architecture:
- Client layer: the front-end interface between the user and the application, responsible for receiving user input and presenting output.
- API gateway layer: handles every request entering the system: routing, load balancing, and initial processing. The gateway is the system’s single entry point.
- Application layer:
- Business-logic service: implements the application’s specific business rules and handles the application logic that is independent of the model. Task-management service: the coordinating core of all services, managing the full lifecycle of a request, and handling task scheduling, monitoring, and state management.
- Service layer:
- Model service: the core component of an LLM application, responsible for managing and running the pre-trained large language model. It covers model loading, inference execution, and result generation. The model service first loads the pre-trained model into memory or onto the GPU. On receiving a request, it passes the input to the model, runs the forward pass, and produces the output. It is also responsible for model versioning, dynamic switching, and performance optimizations — quantization, batching, and similar techniques that improve inference speed and resource utilization.
- Data-processing service: preprocesses input data and postprocesses output data, ensuring the formats meet the needs of both the model and the application.
- Data layer:
- Data-storage service: manages user data, model configuration, and the like, providing persistence and retrieval.
In this layered architecture, components interact through well-defined interfaces. The performance and reliability of the model service directly affect the response speed and output quality of the entire system, which makes it the layer to watch during system design, testing, and optimization.
Testing Approach
The variable parts of a typical LLM system can be roughly divided into the prompt input, the prompt template, and the output content:
- The prompt template is configured by AI engineers or the business product team and is the foundation of output quality;
- The prompt input is the interface exposed to external users. Prompts here vary endlessly and may even be used by bad actors to attack the LLM system;
- The output content is tightly coupled to prompt testing and needs to be evaluated together with it. By controlling variables — holding the input constant — we can obtain relatively objective model output.
Model Evaluation vs. System Evaluation
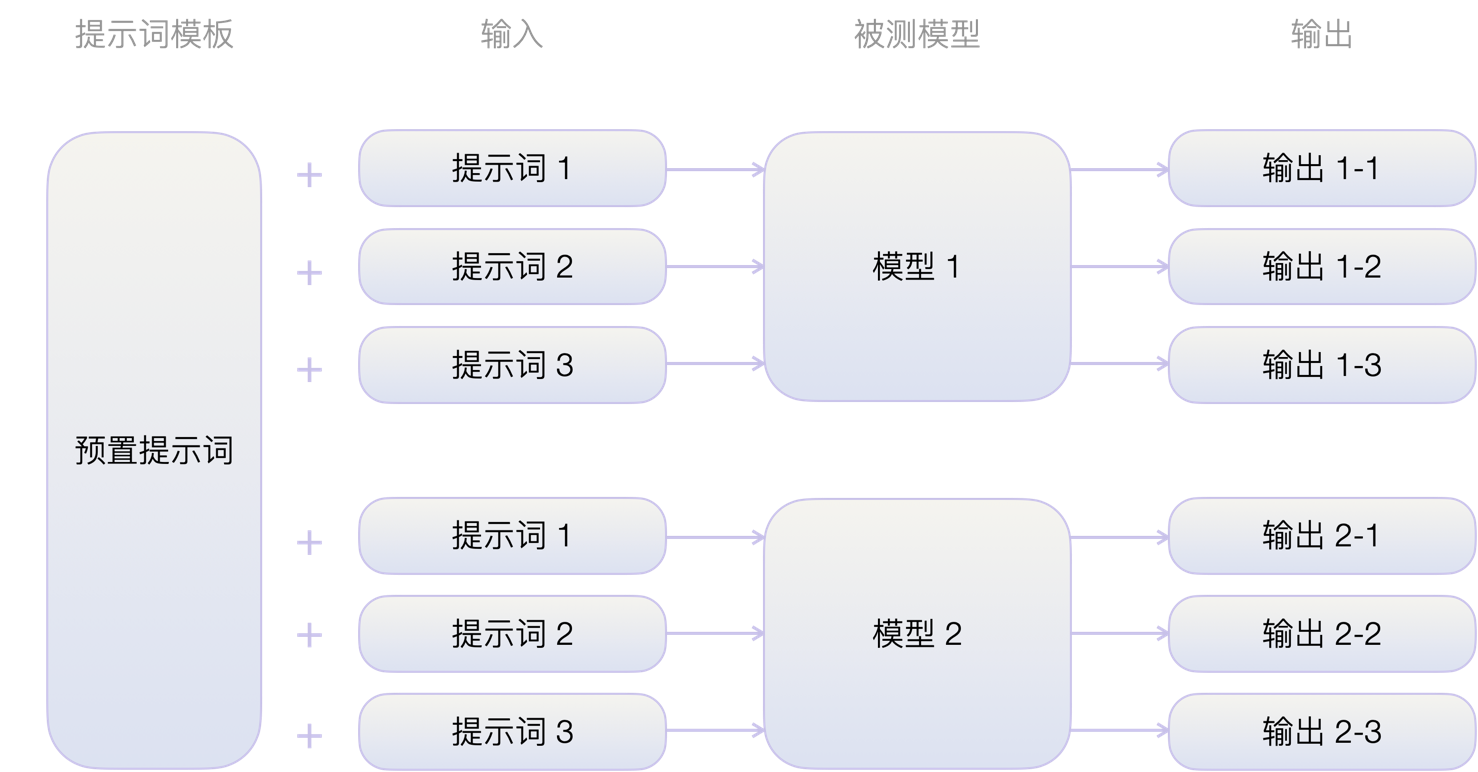
Model evaluation focuses on comparing the performance of different LLMs: multiple models — say, Llama and Vicuna — are tested with the same prompt template and input data to assess how they differ under identical conditions. This makes it possible to compare model capability directly and pick the most suitable model for a given task.
System evaluation (also called task evaluation) looks at the performance of the whole AI system, in particular the impact of prompt design. It tests different prompt templates against the same model to assess how prompt design affects the output, with the aim of optimizing prompt engineering and lifting overall system performance.
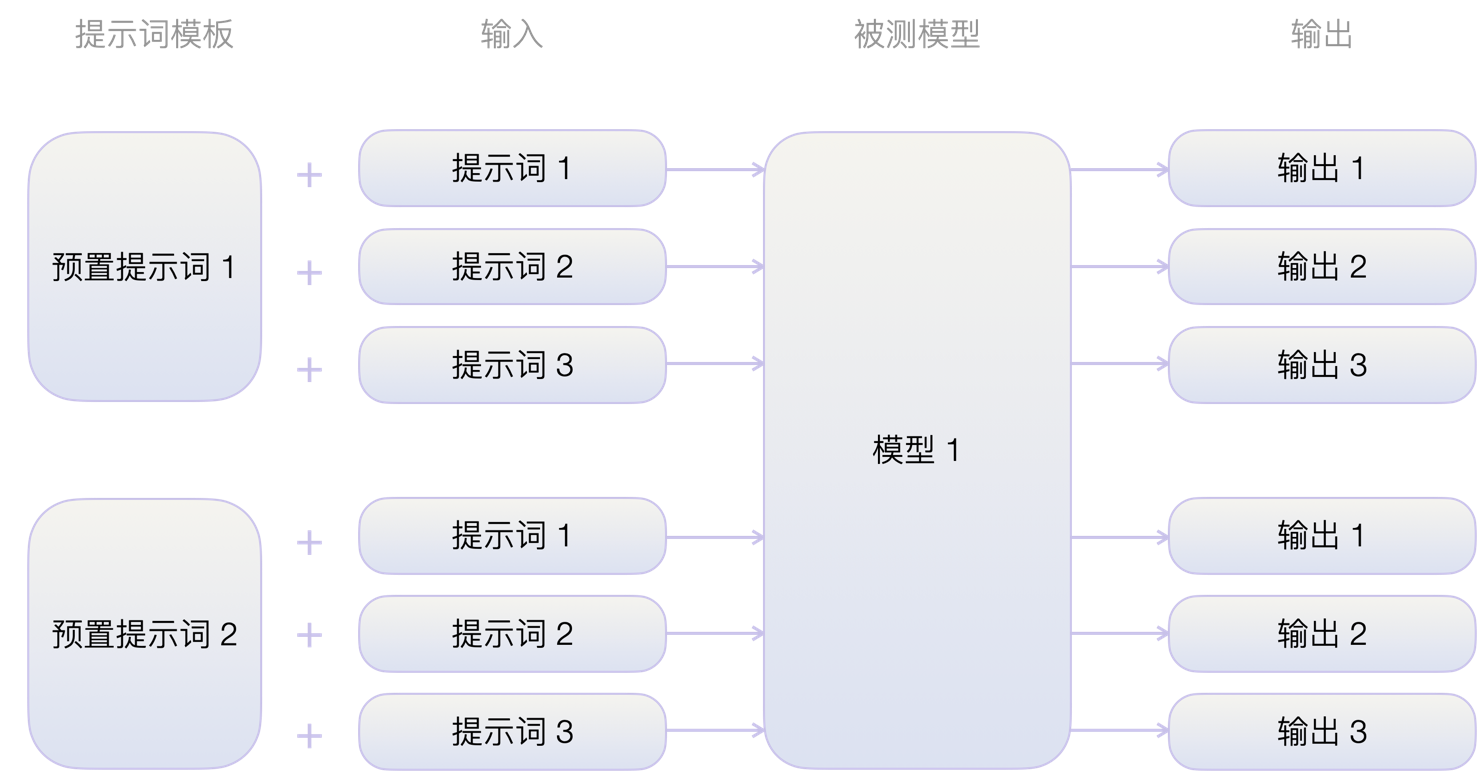
The two answer different questions: model evaluation decides which model to pick, system evaluation decides how to write the prompt. Different tasks call for different combinations of the two, which is why both methods are worth knowing.
System Evaluation Metrics
When evaluating an LLM system we look at several evaluation types, each focused on a specific aspect of model capability. Starting from the business perspective, these types can be broken down into evaluation dimensions and concrete metrics. In practice, analyzing each type lets us select the most relevant dimensions and metrics, and so cover the business comprehensively.
| Evaluation type | Dimension | Description | Test method | Example metrics |
|---|---|---|---|---|
| Knowledge | Accuracy | Agreement between model output and reference answers. | Content-quality testing | Precision, recall, F1 score, etc. |
| Knowledge | Fluency | Naturalness and coherence of the generated text. | Content-quality testing | Coherence, relevance, writing quality. |
| Knowledge | Comprehension | How well the model understands complex text and context. | Prompt testing | Explanation quality (may require human rating), ROUGE score, error tolerance, etc. |
| Safety | Privacy leakage | Prevent the model from leaking private or sensitive data. | Prompt attacks | Binary (leak / no leak). |
| Safety | Misinformation | Detect misleading or inappropriate content in the output. | Prompt attacks | Binary (correct / incorrect), misinformation rate (aggregate). |
| Safety | Toxicity and inappropriate content | Ensure the model does not generate harmful or inappropriate content. | Prompt attacks | Fairness score, binary (appropriate / inappropriate), inappropriate-content rate, etc. (aggregate). |
| Applicability | Task-specific performance | The model’s performance in a specific domain or task. | Content-quality testing | Word-limit pass rate, repetition rate. |
| Applicability | Media content quality | The quality of specific generated content. | Content-quality testing | Grammar error rate (copy), scene relevance (images). |
| Applicability | Engineering performance | The model’s performance inside the production system. | Performance testing | Response time, TPS, etc. |
Business Testing
Scenario Analysis
Start by pinning down the business goals, then design test metrics against them. The metrics should fit the business-process, engineering, and safety scenarios at hand, so that the model’s real-world performance is evaluated in full. Below, customer service, sentiment analysis, machine translation, and content generation illustrate the common business metrics and the points to watch.
In customer service, LLMs mainly provide round-the-clock automated support. Key test metrics include resolution rate, response time, and customer satisfaction. An effective service bot has to respond quickly, and it also has to understand and resolve complex problems accurately — so it is worth adding multi-turn dialogue capability as one of the evaluation metrics, to test how the model handles complex situations.
Sentiment analysis plays a large role in opinion monitoring and customer-feedback analysis. Beyond basic accuracy, precision, and recall, it is worth evaluating the model’s fine-grained analysis and context understanding, which help capture complex emotional expression and implied sentiment.
Machine translation needs a combined view of translation quality, semantic preservation, and fluency. Pair automated metrics (such as BLEU) with human scoring for a full picture. The translation accuracy of domain terminology is also worth tracking, especially in specialized applications.
Content generation is another major application. Here content quality and creativity are the key metrics; human scoring or an automated scoring system built on predefined criteria is the recommended approach. In addition, if the generated content will be processed further or fed into downstream systems, the business needs statistical metrics on the content — mean generated length, median generated length, and so on — to make sure the output meets the input requirements of downstream services.
Designing Evaluation Metrics
For designing and implementing these business metrics, Anthropic offers an instructive suggestion: the core of metric design and selection is building an evaluation system that is fast, reliable, and scalable.
Concretely, an evaluation system should follow three principles: make the task explicit, automate wherever possible, and prefer volume over polish. The third may run against the instinct to pursue high-quality evaluation, but the reasoning behind it is heartwarming.
- First, a larger sample yields more reliable statistics. Even if each individual judgment is less precise than a human rating, volume cancels out individual error and gives a more accurate picture of overall performance.
- Second, more questions cover more scenarios and edge cases, which is essential for evaluating the model comprehensively. Automated scoring may carry some systematic bias, but it removes the subjective bias that human scoring can introduce.
- Finally, automated scoring cuts the time and resource cost of evaluation dramatically, making large-scale evaluation feasible and supporting fast iteration and continuous improvement.
Anthropic describes three common grading approaches: code-based grading, human grading, and model-based grading. The points below focus on model-based grading — in particular, what to watch when one large model evaluates another’s output (in the style of CriticGPT).
- First, write detailed, unambiguous grading prompts. For example: “The answer should always mention ‘hamburger’ in the first sentence. If it does not, the answer is automatically graded ‘incorrect.’”
- Second, the grading criteria should be quantifiable and objective. In practice, require the grading model to output only
TrueorFalseagainst specific conditions, or a score from1to5. Criteria like these make it easier for the model to grade objectively and easier to aggregate results later in bulk automation. - Finally, encourage reasoning but withhold the reasoning from the output. This suits more complex judgment scenarios: for instance, analyze a given terms-of-service text for legality, scope, and potential impact, then output only a
1–5score, where1means “entirely non-compliant” and5means “fully compliant and broadly applicable.” The model is more likely to consider every aspect of the problem, but only the conclusion is kept.
This section only covers Anthropic’s method. Other companies’ practices are worth reading up on and adapting to your own needs.
Practical Exploration
Prompt Attacks
Prompt attacks are an emerging security threat aimed at large language models. In these attacks, malicious actors manipulate the model’s output through carefully crafted input prompts — by injecting malicious code, inducing biased content, or using adversarial examples to disrupt the model, among other techniques. Such attacks can lead to sensitive-data leaks, seriously flawed decisions, or even total system failure. For an LLM system, prompt attacks threaten technical reliability and, worse, users’ trust in the system. The challenge is most acute in applications that let users enter prompts directly, which underlines the urgency of hardening LLM systems.
| Attack type | Definition | Techniques |
|---|---|---|
| Injection attack | Inject malicious code or instructions into the prompt, attempting to trick the model into unauthorized operations. | SQL injection, command injection, code injection, among others. |
| Inducement attack | Use carefully crafted prompts to induce the model into misleading or biased output. | Leading questions or emotionally loaded language that sways the model’s judgment and output. |
| Adversarial attack | Make imperceptible modifications to the model input that cause incorrect output. | Adding adversarial noise, using adversarial examples. |
| Model-manipulation attack | Deliberately train the model through long-term interaction to prefer certain outputs or behaviors. | Repeatedly submitting specific prompts so the model remembers or prefers those inputs. |
| Detection-evasion attack | Craft prompts that slip past the model’s safety checks so malicious content goes unrecognized. | Puns, insinuation, or other covert language tricks that bypass filters or detection systems. |
| Business-specific attack | Combine the techniques above with the specifics of the business to make the model produce anomalous output. | Attacks tailored to the actual business. |
Common Performance Metrics
Performance metrics for LLMs need to be designed from several angles at once to keep the system efficient and the user experience high. They reflect the system’s technical performance as well as how far the business requirements are met. The key design angles are business responsiveness, model inference efficiency, resource utilization, system reliability, and scalability.
| Dimension | Statistic | Meaning | Formula | Influenced by |
|---|---|---|---|---|
| Business responsiveness | QPS | Queries per second | QPS = VU / RT | Concurrent users, average response time |
| Business responsiveness | RT | Average response time | RT = TTFT + AOT / TPS | Time to first token, token generation speed |
| Inference efficiency | TTFT | Time to first token | Grows quadratically with input token count | Input token count, device compute, model architecture, inference optimization |
| Inference efficiency | TPOT | Time per output token | Constant | Device compute, model architecture, inference optimization |
| Inference efficiency | AOT | Average output tokens | AOT = (∑ Token_i) / N | Output token count, request count |
| Resource utilization | GPU utilization | Efficiency of GPU compute usage | (GPU time used / total GPU time) * 100% | Model size, batch size, parallelism strategy |
| Resource utilization | Memory usage | System memory footprint | Memory used / total available memory | Model size, batch size, caching strategy |
| Reliability | Error rate | How often the system produces errors | (Failed requests / total requests) * 100% | System stability, error handling, load balancing |
| Reliability | Availability | Share of time the system is up | (Total time - downtime) / total time * 100% | System architecture, failure recovery, maintenance strategy |
| Scalability | Horizontal scaling efficiency | Performance gain from adding servers | (New perf - old perf) / old perf * 100% | Load-balancing strategy, data distribution, network latency |
| Scalability | Vertical scaling capability | Performance gain from adding single-machine resources | (New perf - old perf) / resource increase * 100% | Hardware upgrades, system optimization, parallel processing |
Why is time to first token (TTFT) quadratically related to the average number of input tokens? The cause is the self-attention mechanism in Transformer models: every input token has to interact with every other input token. This global interaction makes computational complexity grow with the square of the input length — with input tokens, each token attends to the other , so total complexity is .
Beyond input length, TTFT and time per output token (TPOT) are affected by other factors — per-device inference concurrency, model parallelism, and so on — which means they shift dynamically with system load. Device compute, model architecture, parameter count, output length, and inference optimizations also set the baseline values of TTFT and TPOT.
Under full load with fixed input and output lengths, stress testing yields the key performance figures: TTFT, tokens per second (TPS), queries per second (QPS), and average response time (RT). Concurrent users (VU) can be computed as . In a real chat application, however, users need time to type after receiving a response, so the formula becomes , where is the average wait time. As a rule of thumb, times 10 gives a rough estimate of .
In practice, pick the metrics most relevant to the business and the architecture, and monitor and optimize against those.
These metrics interact. Raising may increase ; optimizing may affect overall accuracy. Performance optimization is therefore a balancing act across metrics, looking for the point that best serves the specific application.
Conclusion
Rolling out quality assurance for LLM-backed business calls for a clearly layered strategy.
The first concern is model safety — the cornerstone of the whole quality-assurance system. It covers defense against malicious attacks and abuse, and strict compliance checks on model output. Only with the model’s safety established can the other measures take effect. The focus at this stage is building and enforcing strict data-management policies and fine-grained access control for the model.
Next comes thorough model engineering testing. This stage focuses on finding and fixing the deviations and errors the model can produce in real operation. Comprehensive engineering tests harden the model, keeping its performance stable across diverse environments and under heavy load, and so safeguard its ability to run reliably over time.
Finally, running through the model’s whole lifecycle is continuous effectiveness evaluation, which keeps the model meeting its intended performance standards and business goals. That requires regular evaluation and validation mechanisms and continuous monitoring to keep output accuracy and reliability up. The focus here includes building a comprehensive test suite and evaluation criteria, standing up an automated evaluation system quickly, and continuously improving model performance.
The three stages run in order: only once model safety is established do the results of engineering testing and effectiveness evaluation hold up.